2008 | 2009 | 2010 | 2011 | bron | |
|---|---|---|---|---|---|
EMU-schuld primo | 258 982 | 347 065 | 347 610 | 381 792 | |
EMU-saldo collectieve sector (– is overschot) | – 3 389 | 30 915 | 34 523 | 24 334 | zie tabel 1.1 |
EMU-saldo sociale fondsen1 | 3 320 | – 8 194 | – 9 088 | – 1 314 | zie tabel 1.4 |
Ktv's en financiële transacties | 45 541 | 6 224 | 12 361 | 4 375 | zie tabel 2.11 |
Derdenrekening en overig2 | – 1 730 | – 7 741 | 1 562 | – 42 | |
Overbruggingskrediet FBN/ABN | 44 341 | – 36 516 | – 3 250 | – 825 | |
ING back-up faciliteit | 0 | 15 857 | – 1 926 | – 2 255 | |
EMU-schuld ultimo | 347 065 | 347 610 | 381 792 | 406 065 | |
EMU-schuldquote | 58,2% | 60,8% | 64,4% | 66,0% |
2008 | 2009 | 2010 | 2011 | bron | |
|---|---|---|---|---|---|
EMU-schuldquote primo | 45,3% | 58,2% | 60,8% | 64,4% | |
EMU-saldo collectieve sector1 (– is overschot) | – 0,6% | 5,4% | 5,8% | 4,0% | zie tabel 1.2 |
Interventies in financiële sector | 13,9% | – 6,8% | – 0,2% | 0,2% | |
Overige financiële transacties | 1,7% | 1,5% | 0,1% | – 0,2% | |
Noemereffect bbp | – 2,1% | 2,5% | – 2,2% | – 2,3% | |
EMU-schuldquote ultimo | 58,2% | 60,8% | 64,4% | 66,0% |
2008 | 2009 | 2010 | 2011 | |
|---|---|---|---|---|
Gevestigde schuld | 199 | 212 | 243 | 266 |
Overige schuld | 108 | 86 | 88 | 84 |
Staatsschuld conform EMU-definitie1 | 307 | 298 | 331 | 350 |
2002 | 2003 | 2004 | 2005 | 2006 | 2007 | 2008 | 2009 | 2010 | 2011 | |
|---|---|---|---|---|---|---|---|---|---|---|
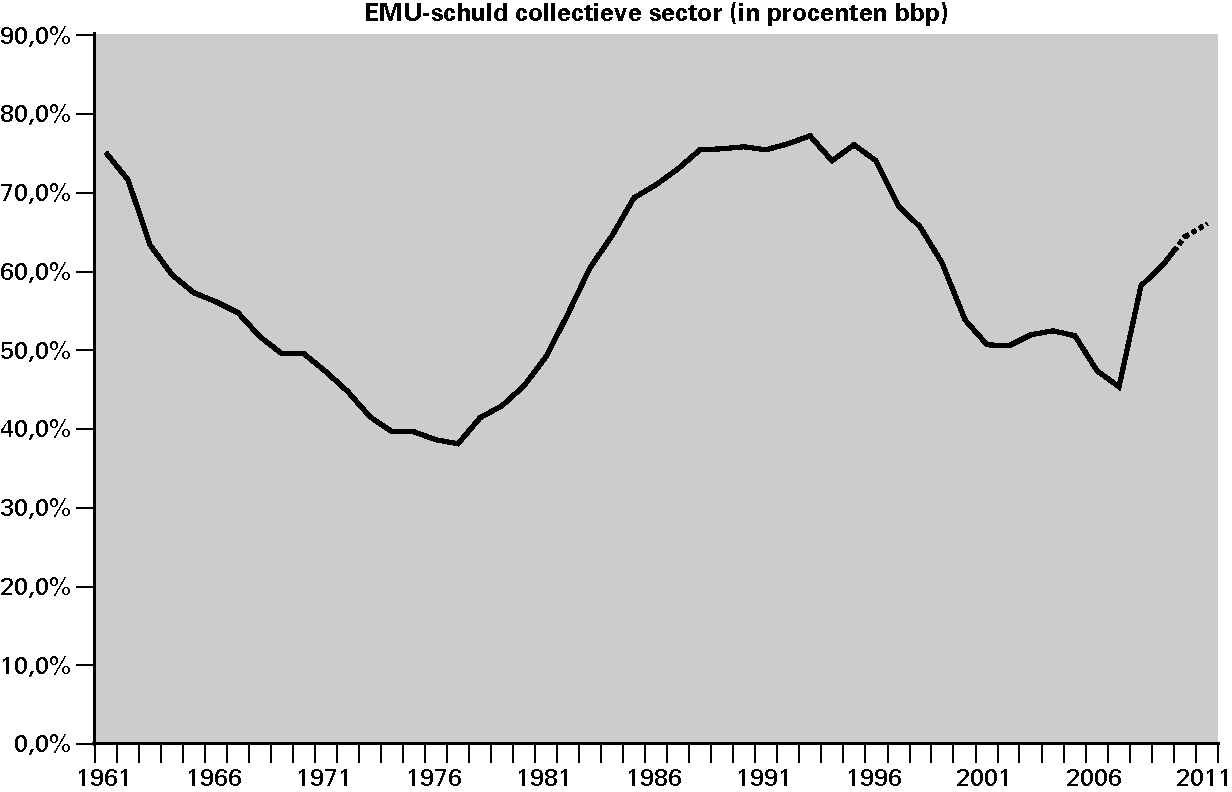
EMU-schuld collectieve sector | 50,5% | 52,0% | 52,4% | 51,8% | 47,4% | 45,3% | 58,2% | 60,8% | 64,4% | 66,0% |
Figuur 4.1 Historisch overzicht EMU-schuld